ÇATALHÖYÜK 2000 ARCHIVE REPORT
    |
Field report on geophysical investigations
Jeofizik Araştırmaları Arazi Raporu
Clark A. Dobbs and Don Johnson
Abstract
Total field and gradient magnetic data were collected. Several possible large structure complexes can be identified in the total field data as were areas which have high magnetic values (often associated with burning). A number of features and structures, including possible structures, rooms, and room fills, were identified in the gradient data.
High-frequency GPR studies appear to have identified areas in Building 3 that contain anomalies which may represent burials or midden deposits. These types of anomalies were not identified in Building 5. Radar was not completely effective in looking beneath the plasters on building walls. Low frequency radar studies outside the buildings identified several interesting large-scale anomalies that may give insights into the structure of the mound itself.
The resistivity data contains more contrast than had been expected. Although the data are still being processed, several of the high resistivity areas approximate the form and shape of structures and might represent buildings of some sort.
The results of this preliminary geophysical project at Çatalhöyük suggest that the use of multiple geophysical methods has the potential to add significant information to the project as a whole at several different scales.
Özeti
Tüm alan ve gradyan manyetik verileri toplanmıştır. Tüm alan verilerinde, yüksek manyetik değerler taşıyan (çoğunlukla yanma ile ilgili olarak) birçok büyük yapı kompleksleri tanımlanmıştır. Gradyan verileri içerisinde olası yapılar, odalar ve oda dolguları tanımlanmıştır.
Yüksekfrekans GPR araştırmaları, Bina 3 içerisinde gömü veya çöp atıklarını temsil eden anomaliler bulmuştur. Bu tür anomaliler Bina 5in içinde tanımlanamamıştı. Yapının duvarlarının sıvalarının altında ne olduğunu anlamakta kullanılan radar fazla etkili olmamıştır. Binaların dışında yapılan alçak frekans radar çalışmaları, höyüğün yapısını ortaya çıkarabilecek oldukça ilginç büyük boyutta anomaliler ortaya çıkarmıştır.
Resistivite verileri, umulandan daha fazla kontrast içermektedir. Veriler hala işlenmekte olduğu halde, bu yüksek resistivite alanlarının şekillerinin bir takım binaları temsil ettiği düşünülmektedir.
Çatalhöyükte ilk defa yapılan bu jeofizik projesinin sonuçlari, değişik jeofizik metodlarının kullanımıyla, projenin tamamına değişik boyutlarda önemli bilgilerin ekleyebileceğini göstermektedir.
Introduction
Between August 28 and September 6, 2000, Don Johnson and Clark A. Dobbs (Hemisphere Field Services) conducted geophysical investigations at the Neolithic site Çatalhöyük, southeast of Konya, Turkey. This work was undertaken as part of the Çatalhöyük Project under the direction of Professor Ian Hodder.
The geophysical studies at Çatalhöyük had two broad goals. The first goal was to determine whether different geophysical methods would be effective on these specific archaeological deposits and whether meaningful geophysical data could be collected from the site. The second goal was to evaluate whether geophysical data could be more broadly integrated with the work of the project team to address specific archaeological and contextual questions at the site.
A series of specific tasks were conducted to meet these goals. These tasks included:
- Collect high-resolution magnetometer data including both gradient and total field. Evaluate whether the higher resolution data provides a more detailed picture of the near-subsurface features than magnetic data collected with a different instrument during the previous magnetic survey.
- Determine whether high-frequency radar can identify variation and/or structural features beneath the plasters on building walls.
- Determine whether high- and medium frequency radar can identify burials and/or other features beneath the floors within buildings.
- Evaluate the potential of medium- and low- frequency radar to delineate horizontal and vertical patterning at the site and determine the depths to which radar may be effective.
- Determine whether soil resistivity can differentiate between various features at the site. If so, evaluate the potential of resistivity to provide 2 and 3-D imagery of the site at various depths.
This field report summarizes the geophysical investigations conducted at Çatalhöyük in 2000 and provides a preliminary evaluation of the data that was collected. A draft report on this work will be provided to the Çatalhöyük team for their comment and evaluation early in 2001. A final report will be prepared that incorporates the comments of team members into the interpretation of the geophysical data.
Instruments and methods
Three instruments were used at Çatalhöyük to collect magnetic, resistivity, and radar data.
Magnetic data were collected using a Geometrics G-858 caesium magnetometer with gradiometer option. This instrument is a state-of-the-art magnetometer that is being used more often at archaeological sites. The high sensitivity, low noise, large dynamic response range, and flexible data collection make this instrument the first choice of many geophysicists. Data were collected in grids that were usually 20 meters square. Individual transects were spaced one-half meter apart and 10 readings per second were taken along individual transects. This resulted in magnetic readings spaced approximately 10 cm apart along each transect.
Radar data were collected using a RAMAC GPR system. Four different antennas were used with the unit including a high-frequency 1 gigahertz antenna; 200 and 400 megahertz antennas; and a low-frequency 50 megahertz antenna. Data were collected in different ways depending on the antenna that was being used.
Soil resistivity data were collected using a Syscal Kid automatic switching multi-electrode system. This is a 24-electrode system that automatically switches between different sets of electrodes to collect data, which can be interpreted as 2D or 3D images of the subsurface. Near-surface resistivity studies were conducted using a dipole-dipole electrode configuration with 1 meter spacing between transects and between electrodes. Additional transects were conducted using 2 and 4 meter electrode spacing to evaluate the depth to which resistivity might be useful at Çatalhöyük.
Horizontal control was maintained by tying all geophysical survey squares and transects into the existing site grid. Survey squares were laid out with tapes relative to existing site survey points. Transect and line spacing was maintained using a series of tapes and ropes. Mr. Stephen Holmes shot in the exact location of the corners of survey squares from the permanent Çatalhöyük datum. Elevation information was obtained from the existing Çatalhöyük topographic survey data.
The primary focus of the geophysical studies was on the north mound. Radar studies were conducted within Buildings 5 and 3 (BACH). The area immediately to the south of these structures was selected for investigation by multiple geophysical techniques because of its proximity to the buildings; the presence of a large scrape area which provided information that could be used to ground truth our geophysical data; and the presence of magnetic data over the area from the previous magnetic survey at the site. An integrated and comparative analysis of all the different types of data from this area is a key part of this project.
Magnetic work was also conducted on the northern part of the East mound and on the West mound and a small amount of radar was conducted on a wall in the deep sounding portion of the South Area.
Summary of data collected
Magnetics
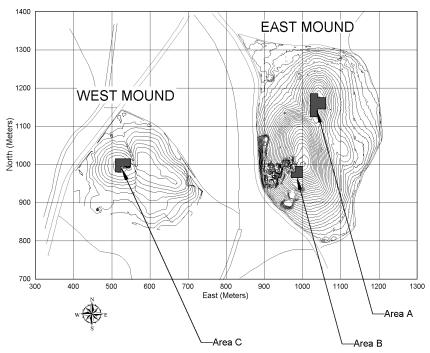
A total of 3,750 m2 of magnetic data was collected in three areas of the site (Figure 18).
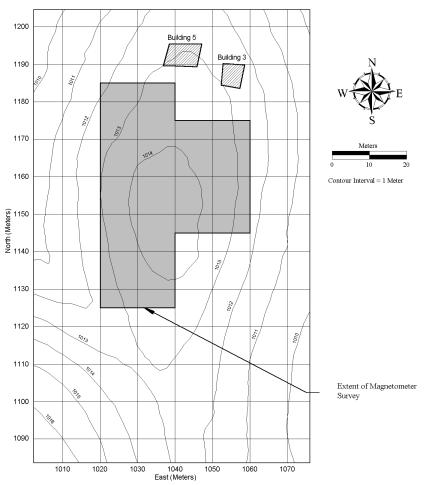
The first area (Area A) surveyed was on the north mound immediately south of Structures 5 and 3 (BACH). The survey area encompassed 1800 m2 within four and a half twenty by twenty meter squares. The coordinates of the survey area are 10201040E, 11251185N and 10401060E, 11451185N. A detailed map of this area is shown in Figure 19.
The second area surveyed (Area B) was on the south mound adjacent to and east of the current area under excavation where the Polish team will be working. The survey area encompassed 750 m2 within two survey units. The coordinates of the survey area are 9701000E, 965980N and 980-1000E, 980-995N.
The third area surveyed (Area C) was on the West mound adjacent to and both north and west of this seasons excavation block. The survey area encompassed 1,200 m2 within three twenty by twenty squares. The corners of these squares were shot in but we have not yet received these coordinates.
Radar investigation in Building 3 (BACH), the South Area, and Building 5
Radar data was conducted from an unexcavated platform on the east margin of Building 3. Five transects parallel to the long axis of platform and spaced approximately 30 cm apart were collected using the 1 GHz antenna. One line perpendicular to the long axis of the platform was collected. Because of the rough surface of the platform, the antenna was manually triggered and readings were taken every 2 cm along each transect. A total of 7.5 m of radar data was collected on this platform.
A vertical radar line was collected using the 1 GHz antenna in the area of the deep sounding in the South Area of the site. This line was collected in the southwest corner of the excavation containing the deep sounding and traversed a series of zones containing different types of mud brick and mortars. The purpose of this radar line was to evaluate whether the high-frequency radar could differentiate between brick, different types of mortar, and areas where mud brick may or may not have been present. A total of 1.3 m of radar data was collected along this line.
A series of radar data was collected in Building 5 using the 200 MHz, 400 MHz, and 1 GHz antennas.
A 5.6 m long radar line was collected from west to east along the top of the baulk on the north side of Building 5. This line was collected since there was well defined stratigraphy visible in the north wall profile that could be compared to the radar data. Data were collected with the 200 and 400 MHz antennas. Because of the relatively rough surface of the baulk, the antennas were manually triggered and data was collected every 20 cm.
Three radar lines across walls were collected using the 1 GHz antenna. One of these lines was vertical along a brick pillar associated with Building 1; one line was vertical across the south wall with plaster on its front and back; and one line was horizontal across this same wall. These initial lines were collected using automatic triggering. However, because of the rough surface of the walls, the data was not as consistent as might be desired.
Two radar lines were collected across one of the platforms using the 400 MHz antenna, which was manually triggered every 5 cm. Three radar lines were collected in this same location using the 1 GHz antenna to compare the 400 MHz and 1 GHz data. The 1 GHz antenna was manually triggered every 1 cm. Two additional lines of 1 GHz data were collected in the eastern part of the Building 5 floor parallel to those collected on the platform. One long line that was perpendicular to these lines was collected with the 1 GHz antenna from east to west across the Building 5 floor.
Radar outside buildings
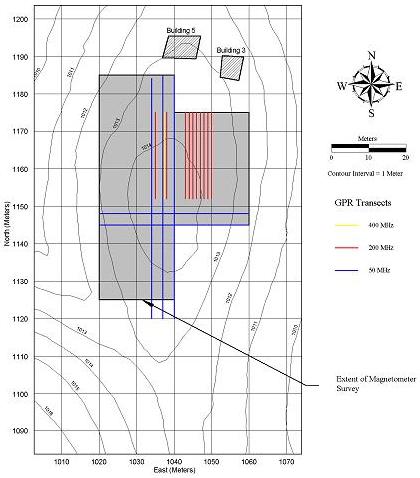
Radar data was collected in the area immediately south of Buildings 5 and 3 (BACH) using the 200, 400, and 50 MHz antennas (Figure 20).
One line of data (Line 1038E from 1175 to 1155N) was collected with the 400 MHz antenna. Unlike the line of 400 MHz data collected in Building 5, depth penetration appeared to be poor and did not extend below about one half meter below surface. Therefore, no further data was collected with the 400 MHz antenna.
Nine and one half lines of data were collected with the 200 MHz antenna. Although we had hoped to collect more with this antenna, it failed during the collection of the tenth line and could not be repaired on-site. Data was collected using one meter line spacing between 1043 and 1050 E from 1155 to 1175 N. Because of the heavy weed cover along many of these lines, the antenna was manually triggered every 20 cm along each line. Depth penetration was better than the 200 MHz antenna and averaged 1 m. However, this was significantly less penetration than that achieved with the 200 MHz antenna in Building 5.
Five lines of data were collected with the 50 MHz antenna. These lines were spaced 3 m apart and were at 1034, 1037, and 1040E from 1120 to 1185N, and 1145 and 1148N from 1020 to 1060E. Because of the heavy weed cover along these lines, the antenna was manually triggered every 50 cm. Depth penetration was about 5 meters.
Soil resistivity
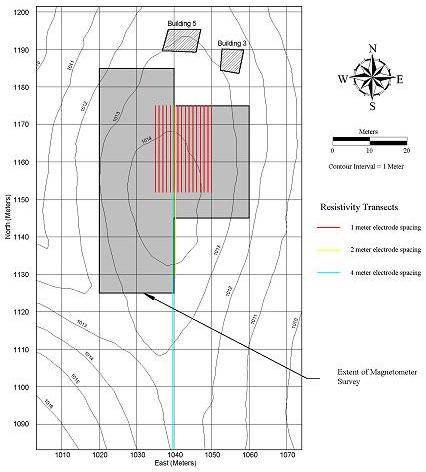
Close-interval soil resistivity data was collected over an area of 345 m2 bounded by 1035-1050E, 1152-1175N (Figure 21). This area was immediately south of Buildings 5 and 3 (BACH) and was a subset of the area where magnetic survey had been collected. Sixteen lines of resistivity data were collected. Spacing between lines was one meter and the separation between electrodes was also one meter.
In addition, two longer lines of data with wider electrode separation were collected to obtain deeper information. One line employed 2 meter electrode separation and extended along the 1040E line from 1129-1175N. The second line employed 4 meter electrode separation and extended along the 1040E line from 983 1175N.
Future directions and preliminary evaluation
Future directions
The next stages of the geophysical study include editing and processing the data collected at Çatalhöyük, preparing maps and images from the data, integrating other datasets with the geophysical information (e.g. scrape plans), and developing interpretations of what the geophysical data may be telling us.
Data processing will include the following tasks:
- Magnetic data: de-stripe and de-stagger as necessary; adjust levels of total field data; interpret data identify possible archaeological features.
- GPR data: apply filters and gains to make anomalies of interest more visible; plot data with uniform scales; compare model curves with data plots; time slice data.
- Resistivity data: edit data to remove noisy points; do 2D inversions; do 3D inversions; plot data in "conventional" method as plan maps.
- Overlay results on base map with scrape map and other information.
If possible, interpretation of the geophysical results will be conducted with several members of the team who have specific knowledge and understanding of the types of archaeological features that may be represented in the geophysical data. Similarly, data interpretation will incorporate as much other non-geophysical data as is possible to confirm our interpretation of different types of geophysical anomalies.
Preliminary evaluation of results
The magnetic survey generally went well, although the presence of high weeds in some areas made data collection more difficult and introduced some noise into the dataset. Nonetheless, the magnetic data contains a great deal of information at a relatively high level of resolution.
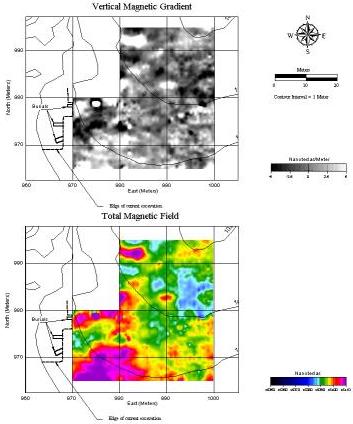
The total field data provides a larger overview of magnetic variation across the study area. Several possible large structure complexes can be identified in the total field data and the distribution of areas which have high magnetic values (often associated with burning) is of particular interest. The gradient data is also quite interesting and a number of features and structures can be identified within it. It appears that the walls and room fills of multiple structures can be identified. Some of the room fills appear to have low magnetic signatures while others appear to have relatively high magnetic values, suggesting that there were episodes of burning in these particular structures. Figure 22 presents a preliminary image of the total field and gradient data from Area B. Note the possible structures in the area of 1.) 970-990E, 965-975N; 2.) 990-1000E 965-980N; and 3.) 990-1000E, 980-990N. The correspondence between the total field and gradient data in areas 1 and 3 is of particular interest in examining the overall patterning in this portion of the site.
The radar survey was more difficult than the magnetic survey and highlighted several issues and logistical problems. To be meaningful, a radar line must be long enough to extend beyond the limits of an anomaly and over undisturbed soil. With either the 200 or 400 MHz antenna, the minimum line length is about 5 meters. The 200 and 400 MHz antennas are fairly large and it was difficult to find areas within Buildings 5 and 3 (BACH) that were open enough to allow the collection of radar lines that were long enough to be meaningful. Similarly, radar antennas need to be in continuous contact with the ground surface. The uneven surface of floors and the numerous excavated features created problems in this regard. The 1 GHz antenna is considerably smaller than the 200 and 400 MHz antennas and was easier to use within the buildings. Because of its smaller size, line spacing of 35 to 50 cm across surfaces is possible. However, the uneven surfaces of walls and floors were also a challenge with this antenna. The automatic triggering wheel on the antenna could not be used and it was necessary to manually trigger the antenna every 2 cm. While effective, this approach is somewhat tedious and increases the amount of time needed to collect the radar data.
We also noted significant differences in depth penetration of the radar. In Building 5, the 400 MHz antenna appeared to have depth penetration of around 1 to 1.5 meters. Outside the building, depth penetration appeared to be around only .5 meters. It appears that the deposits within Building 5 are drier than the rest of the mound, which would explain the greater depth penetration within the building area.
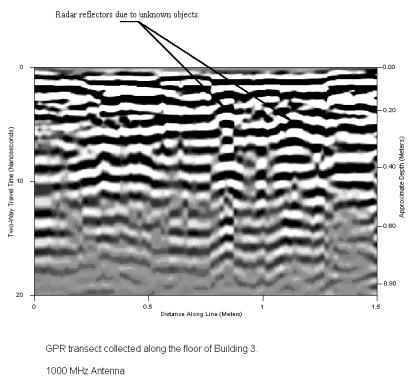
The high-frequency radar did not appear to provide particularly helpful information on the walls within Building 5, although it may have identified some variation on the wall studied in the South Area. However, it does appear that the high-frequency antenna can provide some useful information about the character of deposits beneath the floors. In Building 5, there was little structure in the radar data beneath the floors and no obvious anomalies or point reflectors were identified. In Building 3 there was considerably more structure apparent in the data and Figure 23 shows a preliminary image of one of the radar lines in this building. This example demonstrates the variability of the deposits beneath the floor. It identifies two radar responses from unknown structures. Whether these structures reflects burials, midden deposits, or is created by some other factor is unclear at this time. However, the differences between the two buildings does suggest that the use of high-frequency radar to look beneath plastered floors to depths of around 50 cm has some potential.
The 400 MHz radar data from inside Building 5 appears to be informative and what might be two walls in a structure adjacent to Building 5 to the north were identified in the radar line along the north balk. The 400 MHz radar did not perform well outside of the buildings.
The 50 and 200 MHz radar data appear to contain some information but will require more processing and study before any comments about their utility at this site can be made.
The resistivity survey was relatively straightforward. However, the very dry conditions of the ground surface created some difficulties and it was necessary to water each electrode to ensure that it made adequate contact with the soil. The need to water the electrodes significantly slowed the collection of the resistivity data. In future, a resistivity unit that utilizes a stronger electrical current should be employed and additional time to water the electrodes should be built into the budget.
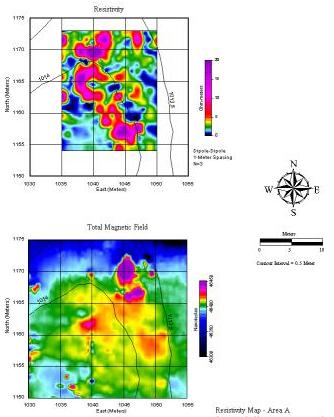
Despite the relatively noisy data, the resistivity survey appears to have produced meaningful data. One concern about resistivity at Çatalhöyük has been that there would be inadequate contrast between the mud bricks and other features, rendering resistivity surveys useless. This does not appear to be the case and there is a significant amount of variation in the resistivity data that was collected, both vertically and horizontally. However, we now need to determine whether the resistivity variation can provide meaningful information on the subsurface archaeological deposits. This issue will be the focus of the processing and interpretation of this particular dataset. Figure 24 presents the resistivity data from Area A. This set of data is from a depth between approximately 0.5 and 1 meter. The total field magnetic data is presented in this figure for comparison with the resistivity data. It is clear that there is significant variation and contrast in the resistivity data although the precise interpretation of this variation remains unclear. However, several of the high resistivity areas approximate the form and shape of structures and might represent buildings of some sort.
The results of this preliminary geophysical project at Çatalhöyük suggest that the use of multiple geophysical methods has the potential to add significant information to the project as a whole at several different scales.
At a very fine scale, the 400 MHz radar could be incorporated into the first stages of structure excavation. For example, it might be useful to conduct a radar survey across a structure as soon as it is identified and when the excavation is still 10 20 cm above the walls of the building. This would allow the collection of long radar transects across the entire house and eliminate the problems with transect length we encountered in Buildings 5 and 3 (BACH). Similarly, high-frequency radar could be used across floors and platforms once they were exposed but before feature excavation took place.
At a broader scale, it could be useful to examine the near-surface, mid-range, and deeply buried deposits at the site. Detailed information on the character and distributions of materials at these various levels could be useful in the long-term stewardship of the site, defining future directions for excavation, and providing contextual information on the variation, character, and distribution of the various types of structures and features within the mound itself. Obviously, this approach would require that the entire project team be involved with the evaluation and interpretation of the geophysical data. Although this model of integrating the archaeological and geophysical interpretation is not often employed in archaeological geophysics, it might prove to be most useful at Çatalhöyük.
Figures
Figure 18: Location Map
Figure 19: Area A, Extent of Magnetometer Survey
Figure 20: Area A, GPR Transect Locations
Figure 21: Area A, Resistivity Transect Locations
Figure 22: Area B, Magnetic Data
Figure 23: Example GPR Profile, Building 3
Figure 24: Resistivity Map - Area A (compared with Magnetometer map)
| |
© Çatalhöyük Research Project and individual authors, 2000